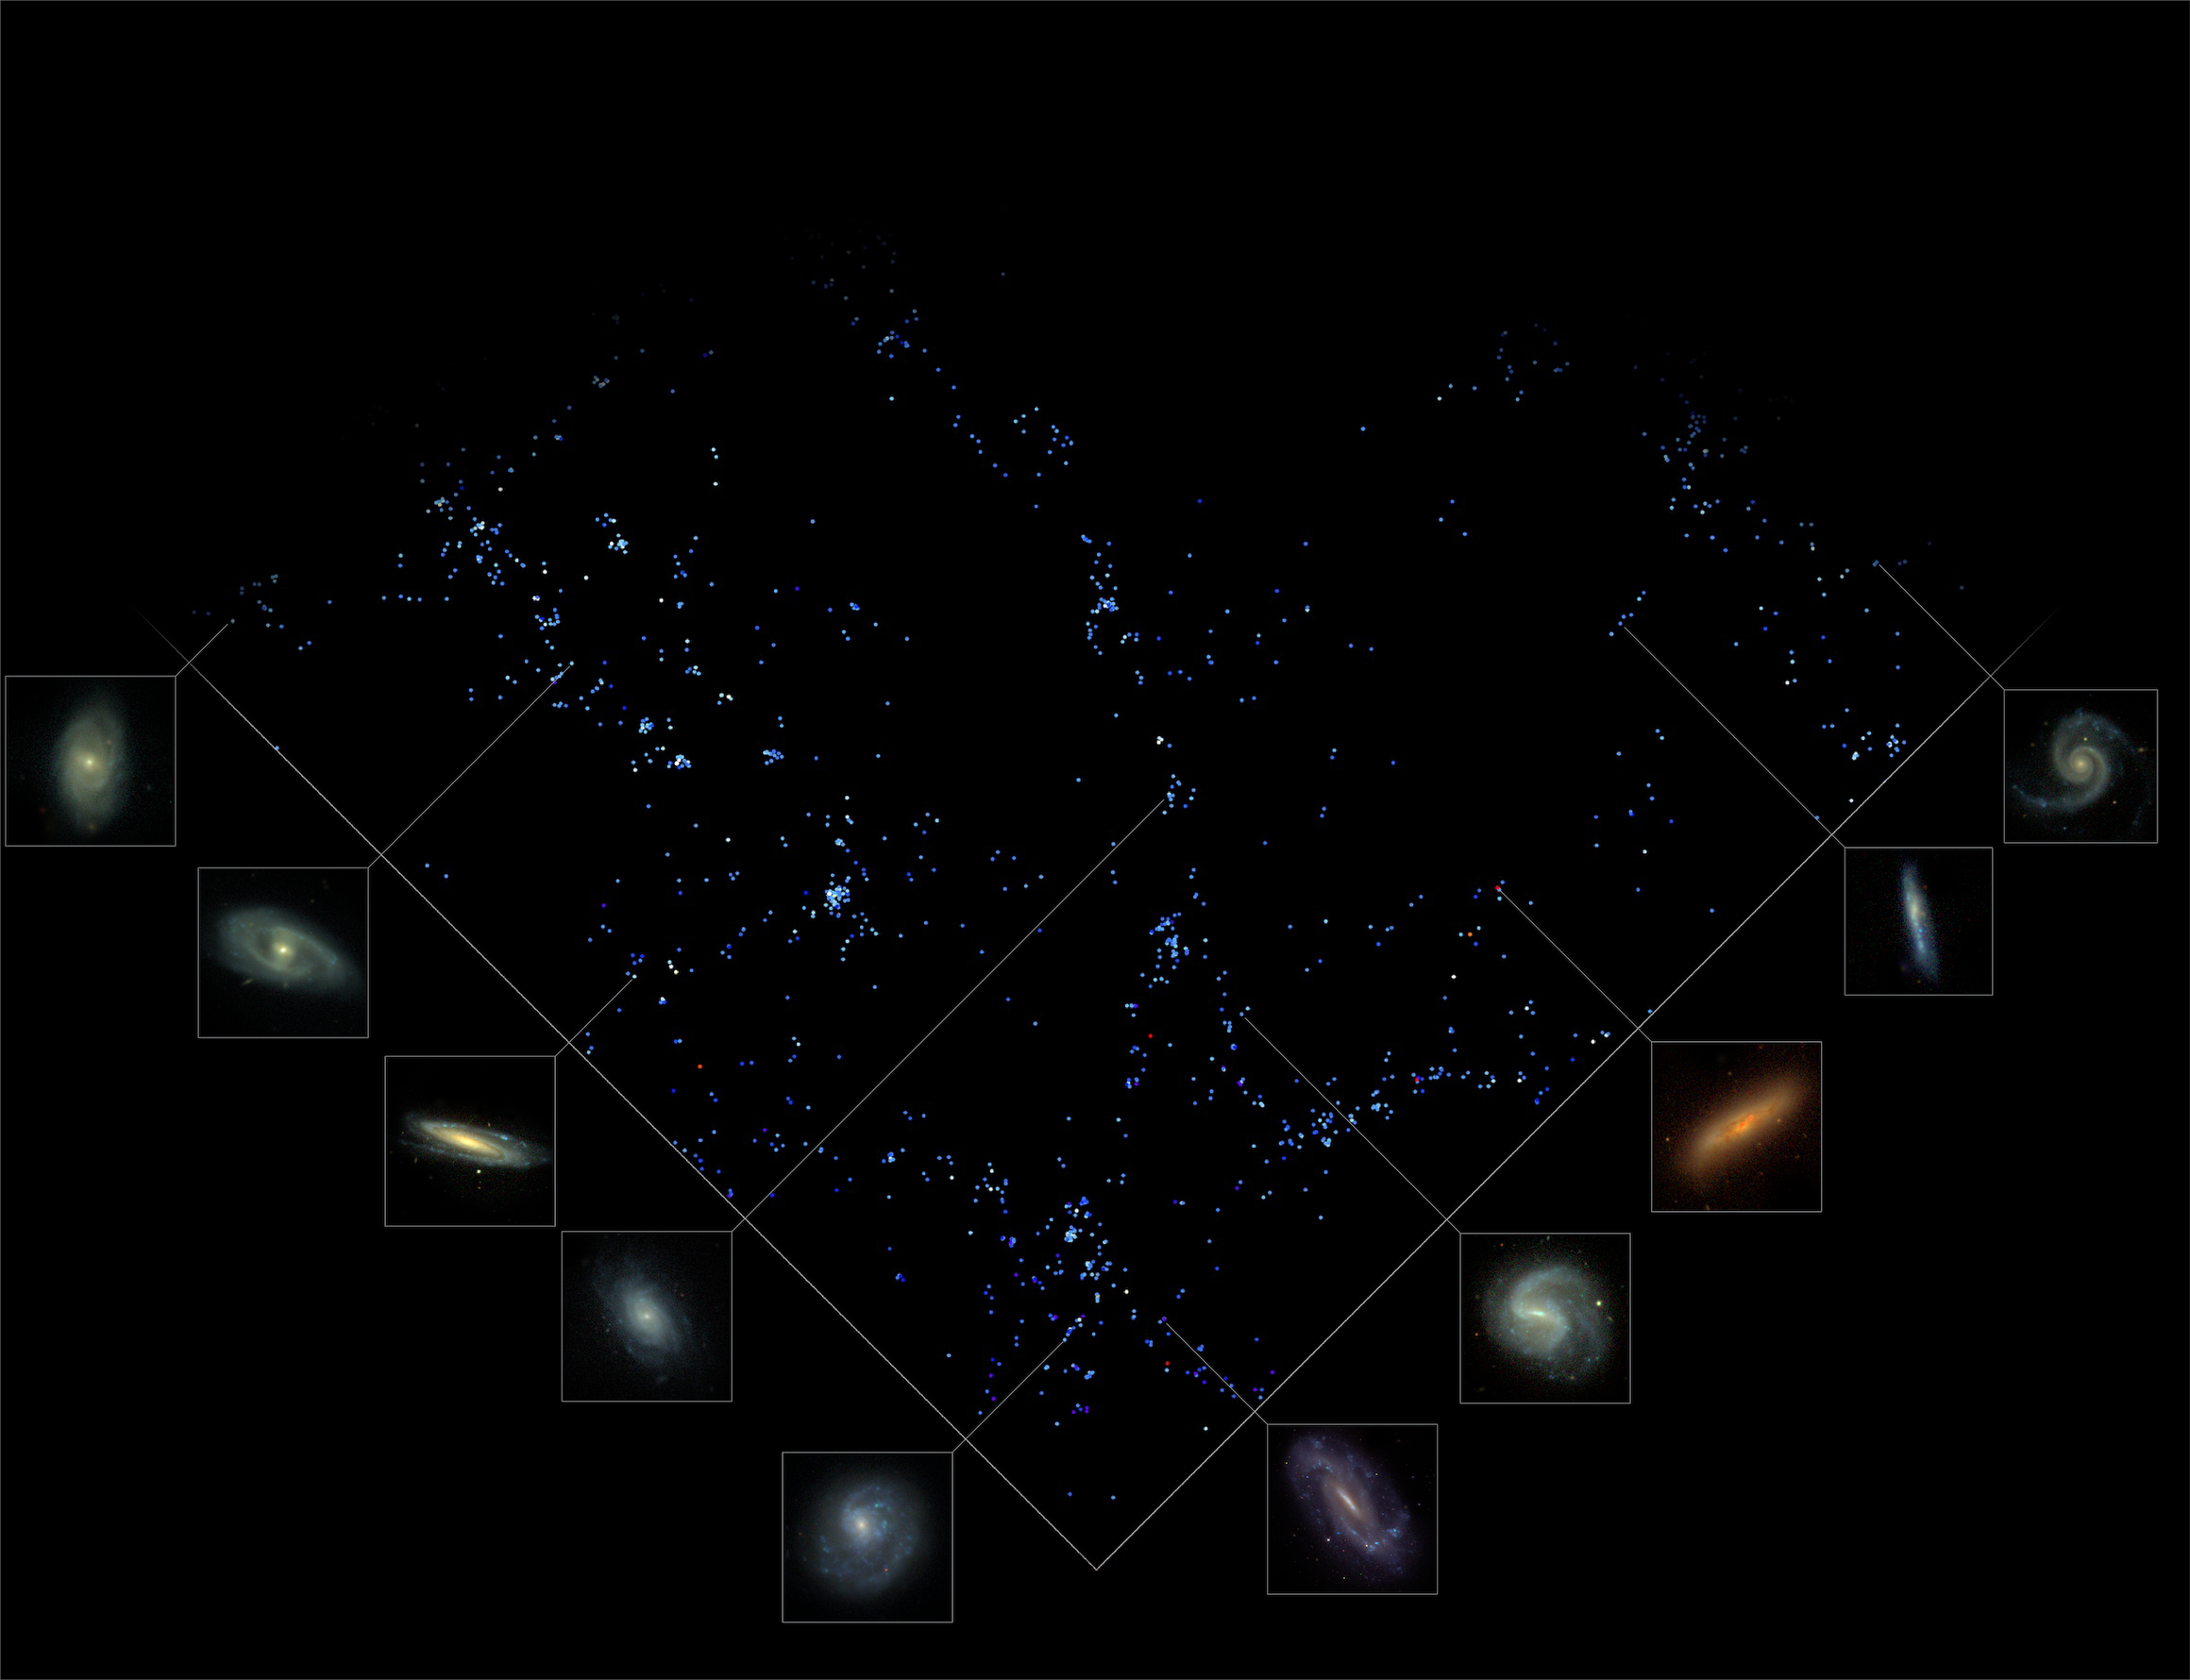


This map shows a slice of our Universe. It was created from astronomical data taken night after night over a period of 15 years using a telescope in New Mexico, USA. We are located at the bottom. At the top is the actual edge of the observable Universe. In between, we see about 200,000 galaxies.
The full map is actually a sphere. This visualization shows a thin slice of the Universe. Its thickness is about 10 degrees. More astronomical data is available but it is not possible to show all of it at once on a 2D map. The image would be completely saturated with dots.
 Each tiny dot is a galaxy. About 200,000 are shown with their actual position and color. Each galaxy contains billions of stars and planets. We are located at the bottom. Our galaxy, the Milky Way, is just a dot. Looking up, we see that space is filled with galaxies forming a global filamentary structure. Far away from us (higher up in the map), the filaments become harder to see.
The Universe expands with time. This expansion stretches the wavelength of light. The farther an object, the redder it will appear to us.
The map shows two blue-to-red redshift sequences: one for galaxies (lower half) and one for quasars (upper half).

The top of the map reveals the first flash of radiation emitted soon after the Big Bang. This happened 13.7 billion years ago. Today we observe this radiation not as visible light but as radio waves.
It is called the Cosmic Microwave Background.

Our galaxy, the Milky Way, is not located at any special position in space. The expansion of the Universe and the redshift effect makes all other galaxies appear redder as we look farther. This map would look similarly if we were looking at the Universe from another galaxy.
Observations were conducted using a dedicated 2.5-m wide-angle optical telescope at Apache Point Observatory in New Mexico, United States.

This project is called the Sloan Digital Sky Survey. It has been running for more than 20 years. It has observed millions of galaxies. A fraction of all the available data has been used to create this map.
The Cosmic Microwave Background was observed using the Planck space telescope by the European Space Agency.

This map shows a slice of our Universe. It was created from astronomical data taken night after night over a period of 15 years using a telescope in New Mexico, USA. We are located at the bottom. At the top is the actual edge of the observable Universe. In between, we see about 200,000 galaxies.
The full map is actually a sphere. This visualization shows a thin slice of the Universe. Its thickness is about 10 degrees. More astronomical data is available but it is not possible to show all of it at once. The map would be completely covered with dots.
Each tiny dot is a galaxy. About 200,000 are shown with their actual position and color. Each galaxy contains billions of stars and planets. We are located at the bottom. Our galaxy, the Milky Way is just a dot. Looking up, we see that space is filled with galaxies forming a global filamentary structure. Far away from us (higher up in the map), the filaments become harder to see.
The Universe expands with time. This expansion stretches the wavelength of light. The farther an object, the redder it will appear to us.
The map shows two blue-to-red redshift sequences: one for galaxies (lower half) and one for quasars (upper half).

The top of the map reveals the first flash of radiation emitted soon after the Big Bang. This happened 13.7 billion years ago. Today we observe this radiation not as visible light but through radio waves. It is called the Cosmic Microwave Background. It is the edge of the observable Universe. Any light emitted beyond that has not yet reached us as its travel time is longer than the age of the Universe.

Our galaxy, the Milky Way, is not located at any special position in space. The expansion of the Universe and the redshift effect makes all other galaxies appear redder as we look farther. This map would look similarly if we were looking at the Universe from another galaxy.
Observations were conducted using a dedicated 2.5-m wide-angle optical telescope at Apache Point Observatory in New Mexico, United States.

This project is called the Sloan Digital Sky Survey. It has been running for more than 20 years. It has observed millions of galaxies. A fraction of all the available data has been used to create this map.
The Cosmic Microwave Background was observed using the Planck space telescope by the European Space Agency.

